通讯作者:马腾、杜尧 教授
通讯单位:中国地质大学(武汉)
https://doi.org/10.1016/j.scitotenv.2022.156659
摘要
随着地层沉积过程的进行,大量的氮(N)被埋藏在沉积物中,从而控制了“地下水-沉积物”系统中氮的来源和归宿。然而,到目前为止,从表层到深层含水层的连续沉积物剖面中的 N 埋藏特征几乎没有受到关注。
本研究通过分析沉积物的岩性、粒度、年代学、可交换氮含量和地球化学指标,揭示第四纪沉积物中氮埋藏特征的控制机制,解释长江中部地下水中氮的富集。
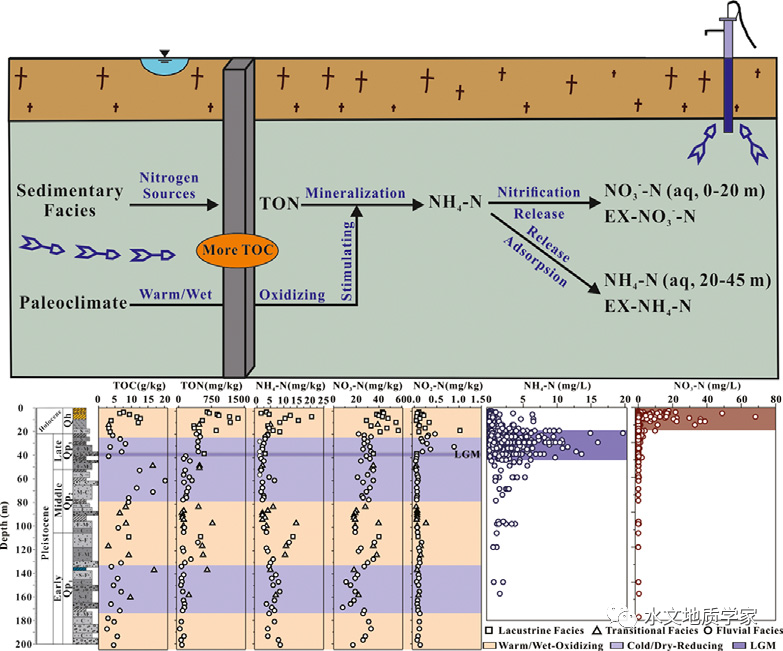
结果表明,两个沉积岩心中埋藏氮的分布趋势相似,表层较高,深层含水层下降至稳定。沉积物中过量的可交换氮(EX-N)含量主要归因于地质成因。氮埋藏特征受沉积环境演化控制:沉积相决定了总有机氮(TON)的浓度,进而影响沉积物的成矿能力;而古气候调节 N 转化过程的强度,最终影响沉积物中 EX-N 的实际浓度。
此外,由于末次盛冰期后冲积沉积物的快速堆积和全新世江汉湖群的快速发育,沉积物中埋藏了丰富的有机质(高TON含量),仍然能够产生更多的铵盐或硝酸盐,并进一步对地下水质量构成持续威胁。本研究从沉积演化角度为高铵含水层的形成提供了新的解释。
△图形摘要
亮点
Depositional environment evolution of Quaternary sediments in the Central Yangtze River Basin is reconstructed.
Nitrogen burial characteristics & controlling mechanisms in two sedimentary cores are identified.
Excessive concentrations of exchangeable nitrogen in sediments are mainly attributed to geologic origin.
A new interpretation for the formation of high-ammonium aquifer in terms of depositional evolution is proposed.
图文导读
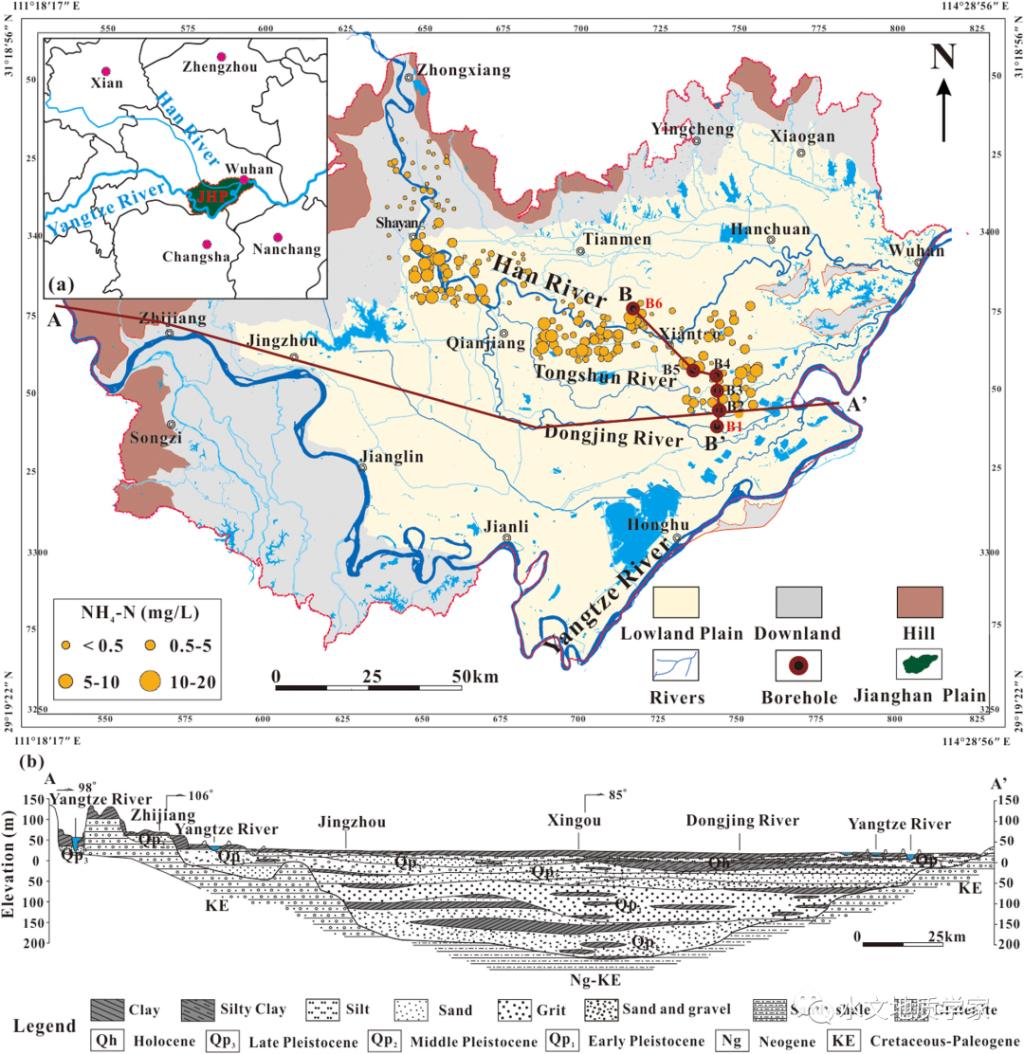
Fig. 1. (a)Map of China, geomorphic types,NH4-N concentrations of shallowgroundwater and the location of major boreholes in the Jianghan Plain. (b) Geological profile of the Jianghan Plain (A-A’ in Fig. 1a).
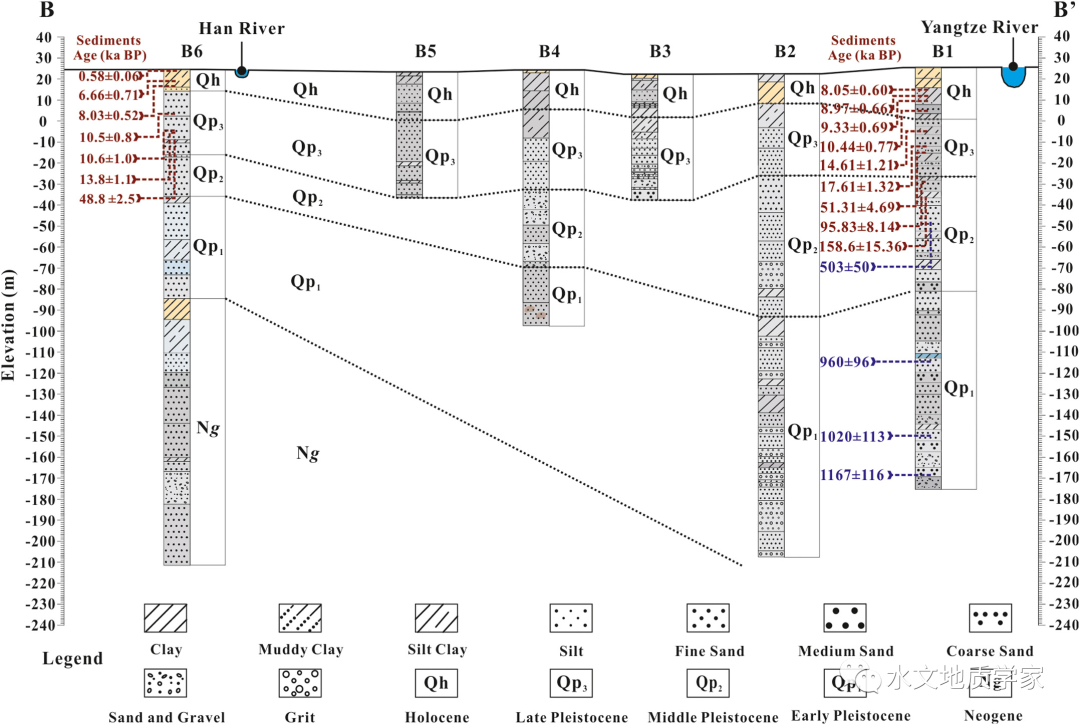
Fig. 2. Stratigraphic division of the typical section (B-B’); the ESR age (adapted from Gu et al., 2018) and the OSL age (adapted from Xu, 2019 and Lai (unpublished data)) of B1 and B6 are denoted in blue and red, respectively.
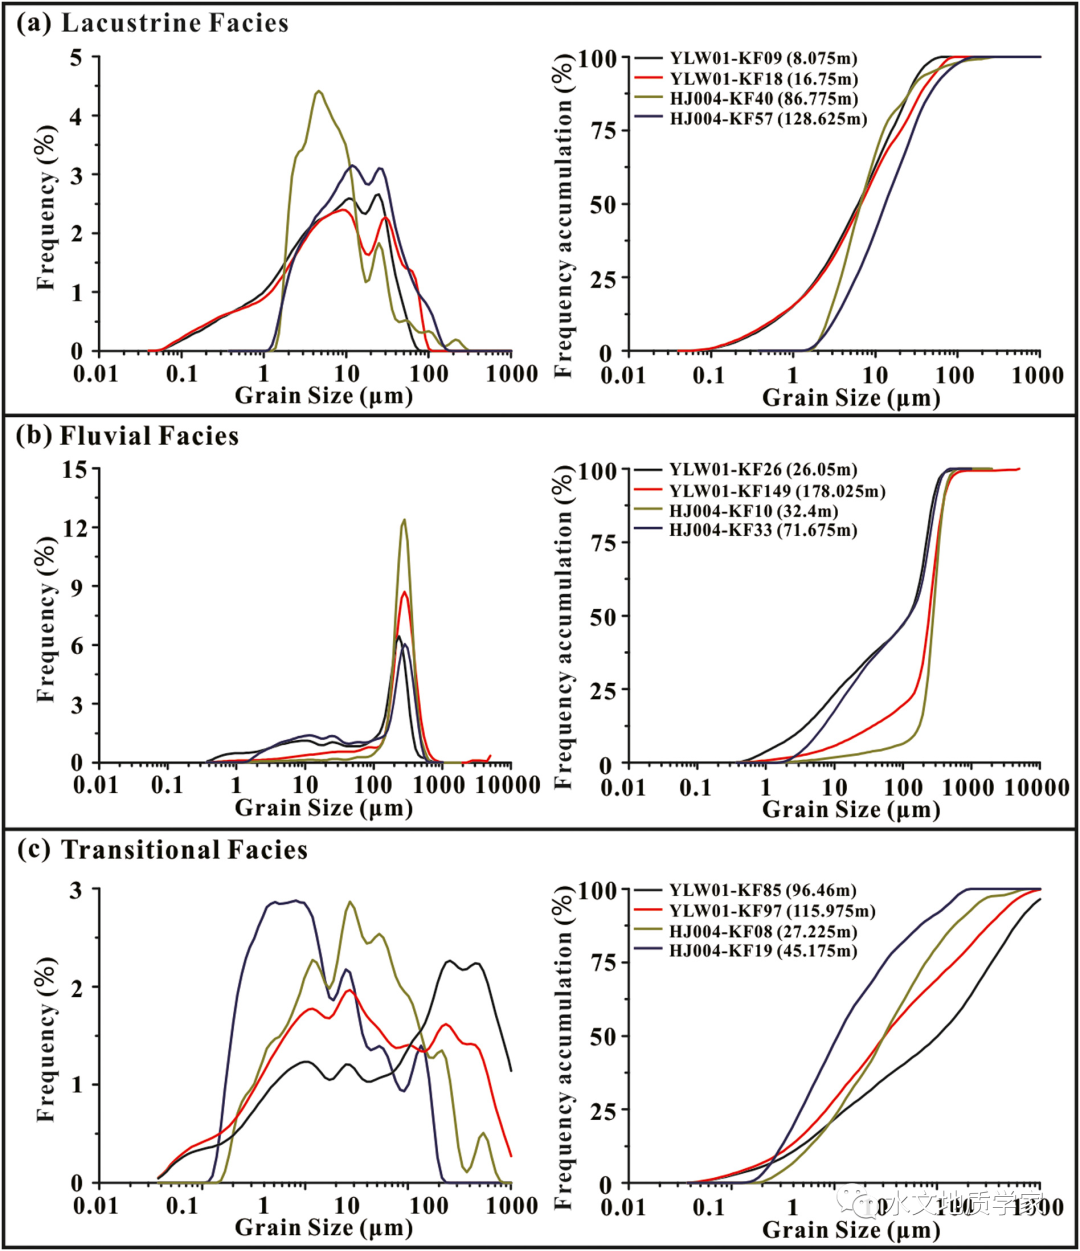
Fig. 3. Grain-size frequency distribution and accumulation curves for typical sedimentary facies in B1 and B6.
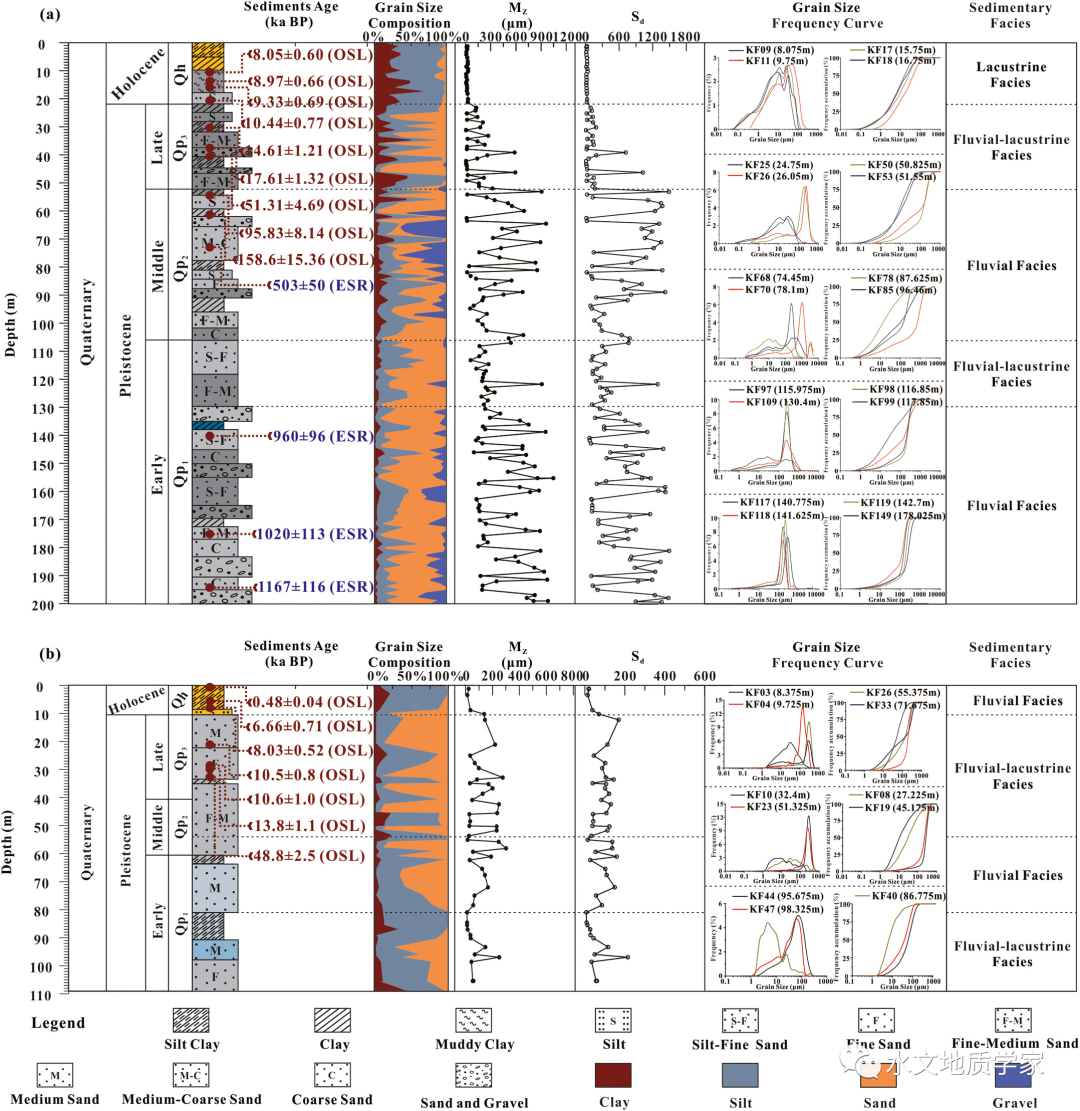
Fig. 4. Distribution of grain-size parameters and division of sedimentary facies in (a) B1 and (b) B6. The fluvial-lacustrine facies was formed by a combination of fluvial, lacustrine or transitional facies.
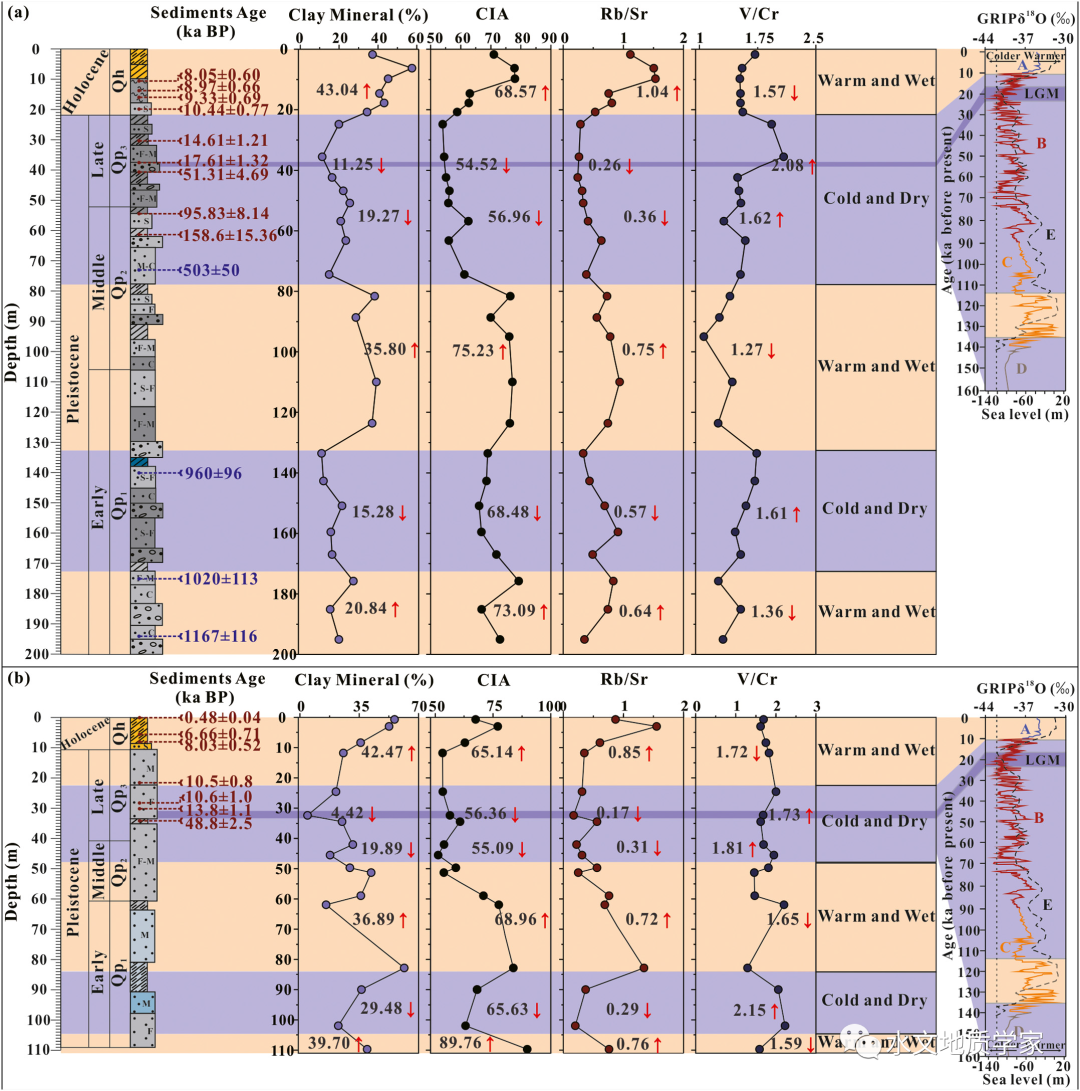
Fig. 5. Distribution of clay minerals, CIA, Rb/Sr, V/Cr and the Quaternary paleoclimate evolution stages in (a) B1 and (b) B6. The δ18O values of ice core (GRIP) within 160 ka and sea-level changes within 140 ka were also shown in the right. Curve A-D represented δ18O values of ice core (GRIP) (adapted from Greenland Ice-core Project Members, 1993; Blum and Törnqvist, 2000; Fronval and Jansen, 1997 and Johnsen et al., 1995); curve E represented sea-level changes (adapted from Bard et al., 1990). The warm (oxidizing) and cold (reducing) environmental condition were denoted in orange and purple, while the deep purple line in figure represented the approximate location of the Last Glacial Maximum (LGM).

Fig. 6. The vertical distribution of TOC, TON, EX-N (EX-NH4-N, EX-NO3-N and EX-NO2-N) contents in sediments for (a) B1 and (b) B6. The lacustrine, transitional and fluvio facies were denoted in square, triangle and circle, respectively.
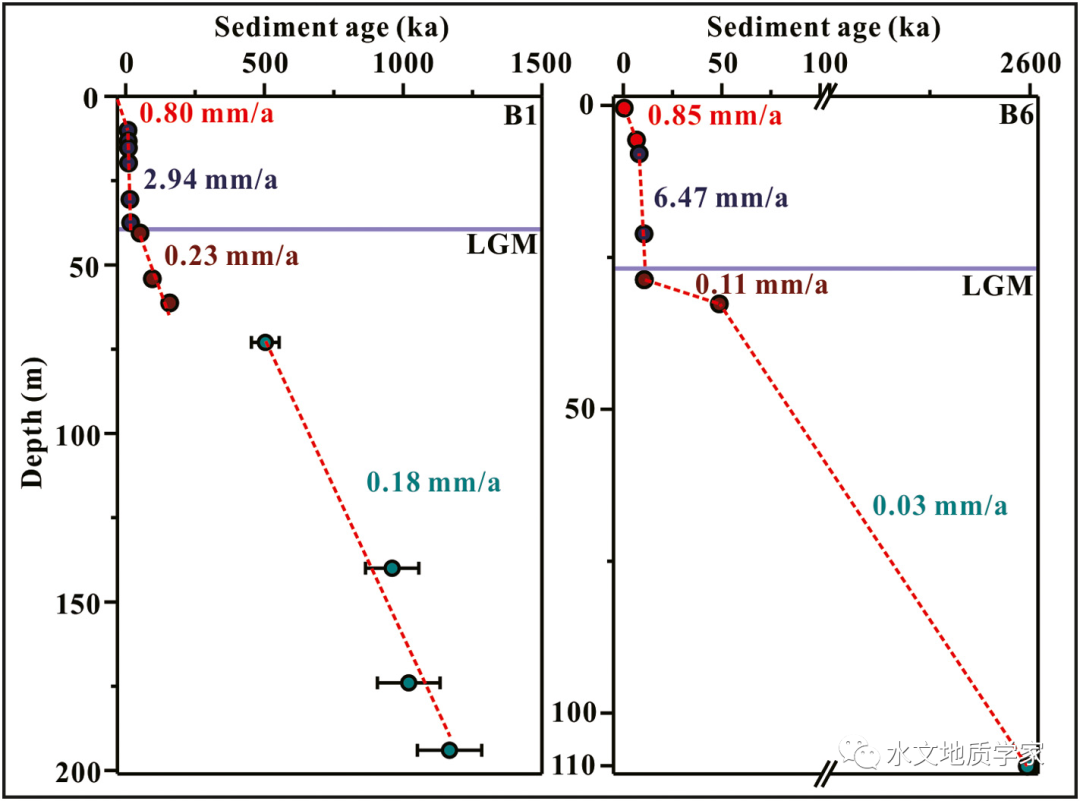
Fig. 7. Deposition rates of sediment in B1 and B6.

Fig. 8. The relationship between (a) EX-N and TON, (b) EX-N and δ15N, (c) Depth and δ15N and (d) C/N and δ13Corg of sediments. δ15N-NH4 in groundwater of JHP were denoted as grey circle (adapted from Du et al., 2017).
原文链接:https://www.sciencedirect.com/science/article/pii/S0048969722037561?via%3Dihub